Navigating Your Inbox Dashboard
This guide explains the Inbox dashboard, a visual overview of the current activity for tickets in your workspace for a specific time range.
Step-by-step interactive guide:
Follow this link for a step-by-step interactive guide on how to use our system.
Finding your Inbox dashboard
- Click the 'Inbox' icon in the navbar on the left of your screen
- Then click 'Dashboard' in the Inbox navigation.
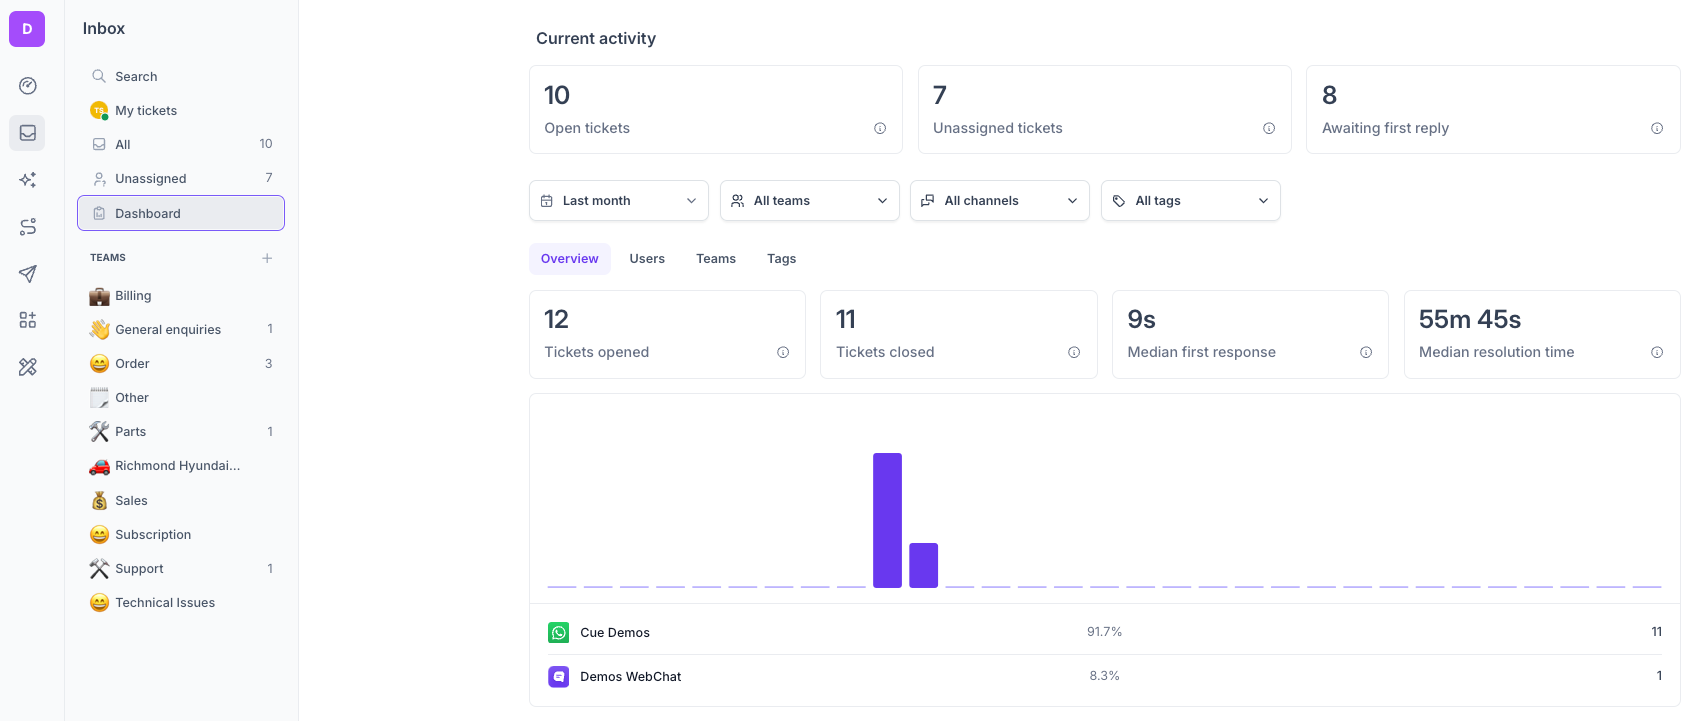
Current activity
These stats show what is currently happening in your workspace at the present moment.
- Open tickets - Total number of tickets currently open. This number includes tickets that may not be visible to you. This occurs when tickets are assigned to a team that you do not belong to.
- Unassigned tickets - Total number of open tickets that do not have an agent assigned. This number includes tickets that may not be visible to you. This occurs when tickets are assigned to a team that you do not belong to.
- Awaiting first reply - Total number of tickets awaiting a first reply from an agent. This number includes tickets that may not be visible to you. This occurs when tickets are assigned to a team that you do not belong to.
Past activity
Filters
Date range - You can filter data to your desired date range by clicking on the date drop-down. Then select the appropriate date range, and the dashboard will automatically update its data accordingly.
Teams - Click the drop-down arrow to filter and select your desired team(s), and the dashboard will automatically update its data accordingly.
Channels - Click the drop-down arrow to select your desired channel, i.e., WhatsApp, Facebook Messenger or WebChat, and the dashboard will automatically update its data accordingly.
Tags - Click the drop-down arrow to select or type your desired tag(s), and the dashboard will automatically update its data accordingly.
Overview
Displays the activity of tickets and channels within a defined time period. Hover over the bars to see a filtered timeline of tickets opened. Below the timeline, you'll find the channels that received tickets during the selected period, along with a percentage breakdown of total tickets opened by each channel and the overall number of tickets, segmented by channel.
- Tickets opened - Total number of tickets that were created for the selected time period and filters.
- Tickets closed - Total number of tickets that were closed for the selected time period and filters.
- Median first response - Median is the middle between the smallest and largest value in a range. This value shows the median first response time of tickets created for the selected time period and filters.
- Median resolution time - Median is the middle between the smallest and largest value in a range. This value shows the median resolution time of tickets created for the selected time period and filters.
Users
Provides statistics for each User based on a specific time period.
- Open - Shows the number of open tickets within a specific time period.
- Closed - Shows the number of closed tickets within a specific time period.
- Total - Shows the total number of open and closed tickets within a specific time period.
- 1st Response - Shows the average time taken to provide the first response to all tickets within a specific time period.
- Average Response - Shows the average time taken to respond to all tickets within a specific time period.
- Resolution - Shows the average time taken to resolve all closed tickets.
Teams
Provides statistics for each team within a specific time period.
- Open - Shows the number of open tickets within a specific time period.
- Closed - Shows the number of closed tickets within a specific time period.
- Total - Shows the total number of open and closed tickets within a specific time period.
- 1st Response - Shows the average time taken to provide the first response to all tickets within a specific time period.
- Average Response - Shows the average time taken to respond to all tickets within a specific time period.
- Resolution - Shows the average time taken to resolve all closed tickets.
Tags
Provides statistics for each tag within a specific time period.
- Open - Shows the number of open tickets within a specific time period.
- Closed - Shows the number of closed tickets within a specific time period.
- Total - Shows the total number of open and closed tickets within a specific time period.
- 1st Response - Shows the average time taken to provide the first response to all tickets within a specific time period.
- Average Response - Shows the average time taken to respond to all tickets within a specific time period.
- Resolution - Shows the average time taken to resolve all closed tickets.