
How to use the inbox dashboard
The inbox dashboard shows how your team is handling chats and calls in your Cue workspace. You can see what's happening right now, look back over a period of time, and break the figures down by team, user, channel or tag. This guide explains how to read the dashboard, what each figure means, and how to filter and download the data.
Opening the dashboard
The dashboard is in the sidebar of your conversations inbox.
How to open the dashboard
- Open app.cuedesk.com
- Go to your conversations inbox
- Click Dashboard in the sidebar
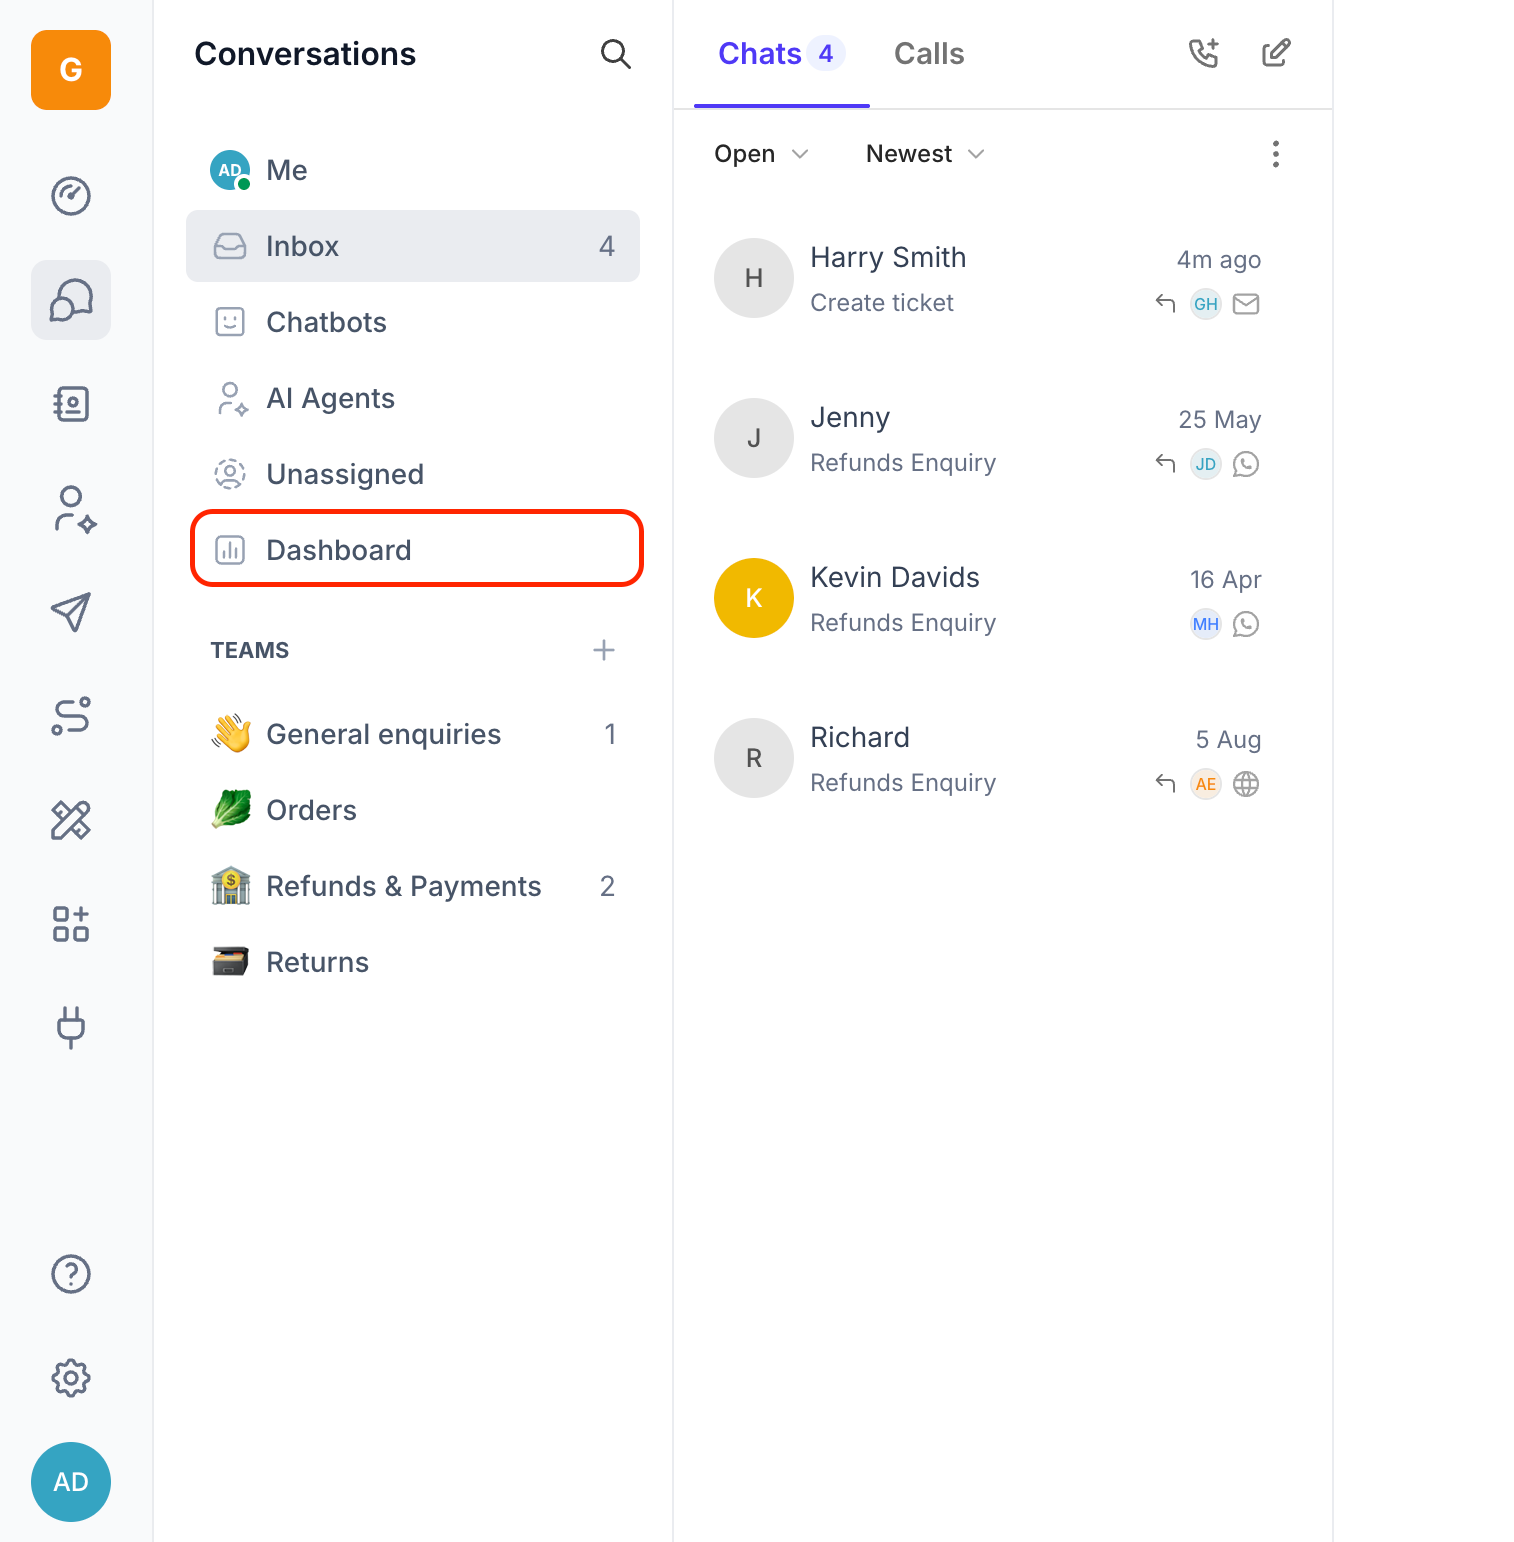
The dashboard opens with summary tiles at the top and a table underneath. Everything on the page follows the date option and filters you choose at the top.
Choosing a date option
The date picker in the top left controls the period the dashboard covers. There are two kinds of option:
- Current shows what's happening right now, such as open chats, calls in progress and callers waiting in a queue.
- Today, Yesterday, Last 7 days, This month, Last 30 days and Last quarter show totals and averages for that period.
- Custom lets you pick a specific day or a start and end date, for example to report on a single day last month, limited to a 30 day range.
How to change the date option
- Click the date picker in the top left
- Select the period you want to see
The tiles and table update straight away.
How to choose a custom date range
- Click the date picker in the top left
- Select Custom
- Pick a start date and an end date. To see a single day, pick the same date twice
The tiles and table update to cover the dates you picked. The comparison under each figure uses the same number of days immediately before your range.
Reading the tiles for Current
When you pick Current, the tiles change to show what's happening right now, along with a few figures for today so far. These figures update by themselves, so you don't need to reload the page.
Chat tiles
- Open chats: chats that are open right now, split into inbound and outbound.
- Unassigned chats: open chats that aren't assigned to anyone, with the longest wait shown underneath.
- Awaiting reply: open chats where the contact is waiting for your team to reply, with the longest wait shown underneath.
- Median first chat response: the typical time to a first reply for chats today.
Call tiles
- Calls in progress: calls happening right now, split into inbound and outbound.
- Queued calls: callers waiting in a queue right now, with the typical queue time for today underneath.
- Abandoned calls: calls abandoned today, with how long those callers typically waited.
- Median call duration: the typical length of answered calls today.
Reading the tiles for a period
When you pick a period, such as Last 7 days, the tiles show chat figures in the top row and call figures in the bottom row.
Chat tiles
- Inbound chats: chats started by your contacts.
- Outbound chats: chats started by your team.
- Median first chat response: the median time it took your team to send a first reply.
- Median chat duration: the median time a chat stayed open before it was closed.
Call tiles
- Inbound calls: calls made to your workspace. The line underneath also shows the median time it took to answer (for example, ~21s to answer).
- Outbound calls: calls made by your team.
- Abandoned calls: calls where the caller hung up before anyone answered, either while waiting in the queue or while an agent's phone was ringing. The line underneath shows how long those callers typically waited (for example, ~1m 46s in queue).
- Median call duration: the typical length of an answered call, from pick-up to hang-up.
Comparing with the previous period
Under each figure you'll see a percentage with an arrow and vs previous period. This compares the figure with the period of the same length immediately before it. For example, with Last 7 days selected, it compares with the 7 days before that.
A green arrow means the figure moved in a good direction and a red arrow means it moved in a bad direction. For example, more inbound chats shows green, while fewer abandoned calls shows green and more shows red.
Breaking figures down in the table
The table under the tiles breaks the figures down by Teams, Users, Channels or Tags. Use the Chats and Calls switch on the right to choose which figures the table shows.
How to change the table view
- Click Teams, Users, Channels or Tags above the table
- Click Chats or Calls on the right
The columns change depending on the tab, the Chats or Calls switch, and whether you've picked Current or a period. A dash (—) means there's nothing to show, for example the queue time for a team that had no queued calls.
Chat columns
- Inbound and Outbound: chats started by contacts and by your team.
- Total: all chats in the period.
- Closed: chats that were closed.
- Unresponded: open chats where the contact is still waiting for a reply.
- First response: the typical time to a first reply.
- Duration: the typical time a chat stayed open.
- Open Inbound and Open Outbound (Current only): chats that are open right now.
Call columns
- Inbound and Outbound: calls received and calls made.
- Answered: inbound calls that were picked up by an agents and outbound calls that connected.
- Abandoned: calls where the caller hung up while in the queue.
- Unanswered: calls that ended without anyone picking up, for example because the queue timed out, no agents were online, or an outbound call wasn't answered or was busy. The difference from Abandoned is that the caller didn't hang up.
- Queue time: how long callers typically waited in a queue before they were answered.
- Duration: the typical length of an answered call.
- Active Inbound, Active Outbound and Queued (Current only): calls in progress and callers waiting right now.
Team and user columns
- Members (Teams): the number of people in the team.
- Online now (Teams, Current only): team members who are online right now.
- Time online (Users): how long the user was online.
- Talk time (Users): how long the user spent on calls.
- Missed (Users): calls that rang for the user but weren't answered by them. A user's inbound calls equal their answered calls plus their missed calls.
- Pickup time (Users): how long calls typically rang before the user answered.
Filtering the dashboard
Use the filters at the top of the page to focus on part of your workspace. Filters apply to the tiles and the table, for both chats and calls. You can combine them, for example a single team on a single channel.
How to filter by team, channel or tag
- Click All teams, All channels or All tags
- Select one or more options from the list
To go back to the full figures, clear the filters you selected.
How to search the table
- Click the search box above the table (for example, Search teams)
- Type a name
The table only shows rows that match what you typed.
Downloading the data
You can download the table you're looking at to use in a spreadsheet. The file includes the same date option, filters, tab and Chats or Calls choice you have on screen.
How to download a table
- Set the date option, filters, tab and Chats or Calls you want
- Click the download icon to the right of the search box
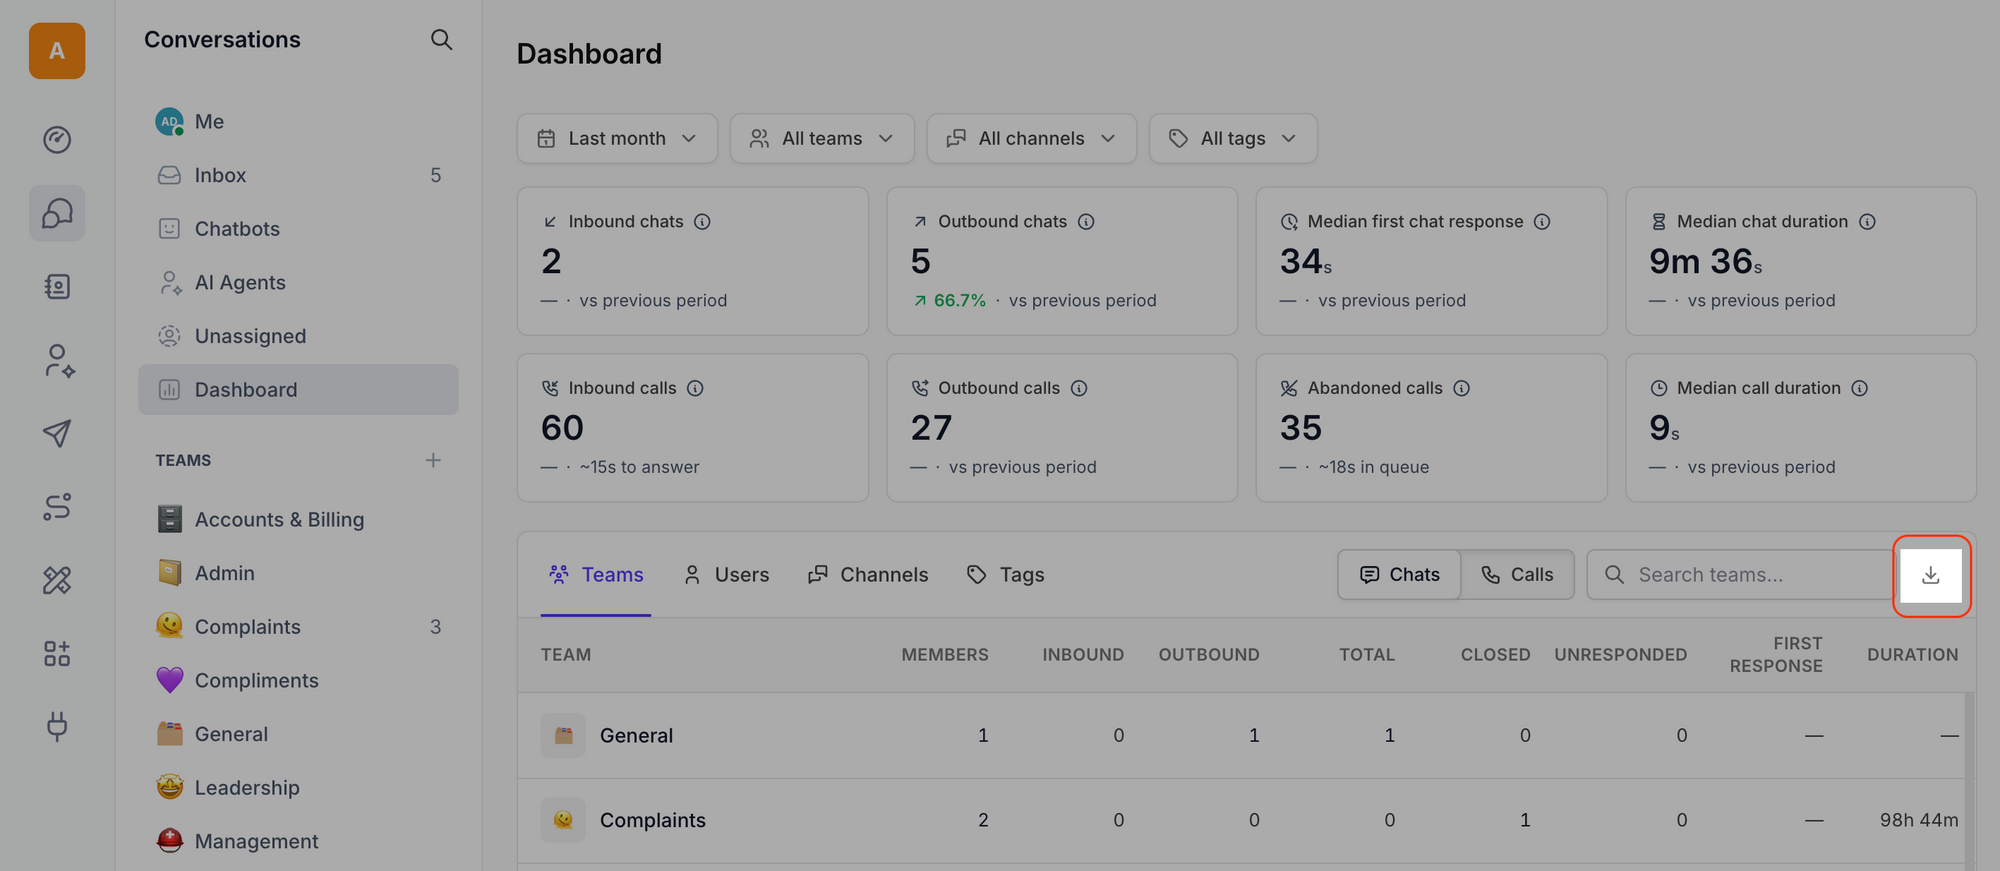
The file downloads to your computer.
Frequently asked questions
Why do some figures show a dash (—)?
A dash means there's nothing to show for that figure. For example, a channel that only handles chats shows a dash in every call column, and a team with no queued calls shows a dash for queue time.
Why is there no percentage under some tiles?
The comparison needs figures for the previous period. If there was no activity in the previous period, there's nothing to compare with.
What's the difference between Abandoned and Unanswered calls?
An abandoned call is one where the caller hung up before anyone answered. An unanswered call is one that ended without anyone picking up while the caller was still on the line, for example because the queue timed out or no agents were online.
Do calls count towards chat figures?
No. Chat figures only include chats, and call figures only include calls.
Why can’t I see an archived team in the dashboard?
Archived teams are hidden from All teams so their old figures don’t change your totals. To see an archived team, select it in the team filter. It’s marked as "Archived" in the table.